


It’s hard to make good product decisions when you don’t know where your team is at. While Jira is extremely powerful, its native reporting functionality can be restricting. Using the number of issues completed to track the progress of epics means you never know whether an epic is a week or a month away from release. Looking for a more reliable solution? Our blog shows you how to get more accurate insights with epic progress reports.
Why are accurate Jira epic progress reports so important?
If you’ve ever wanted to track Jira epic progress based on completed story points or time spent, you’ll have found it’s not the easiest process.
While it’s not hard to work out the progress of your epics in terms of the number of issues completed, this approach can give you a false reading if you’re using estimates.
Example: One issue can be estimated as one story point and another as 10 story points. If one out of two issues is complete, Jira will show your epic as being 50% done. However, if the completed issue was the smaller one (one story point), your real progress would actually only be 10%.
This problem also occurs when using time estimates. A story with an original estimate of one hour is treated the same as a story with an original estimate of eight hours.
The situation is compounded if you’re trying to work out the progress of a group of epics. Those error-riddled calculations roll up to give you a distorted view of how your project or release is going.
If you want more accurate insights into how your epics are progressing, you’re going to need to track them in a more granular way.
Fine-tune your progress tracking with Jira’s built-in epic Report and epic Burndown Report
One way to track epic progress based on story points or time spent is to use Jira’s built-in epic Report feature. This lets you select any epic or epic link and track the total number of story points completed or total time logged. It gives you an indication of how far away your epic is from being completed based on the progress of its child issues.
This is a useful report if you don’t have many epics, as you can see exactly how much of your epic has been completed and how much work is left to do. However, if you want to track the estimate progress of multiple epics as a group, it might not be enough. This is because Jira’s epic Report only lets you track the progress of one epic or epic link at a time.
Jira’s built-in epic Burndown Report
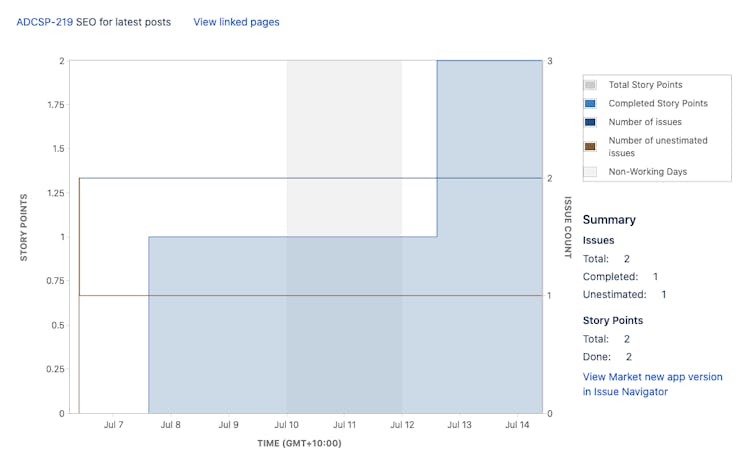
Another option for tracking epic progress is Jira’s built-in epic Burndown Report. Like the epic Report, you can track the total number of story points completed or time logged against an epic or set of epic links. You can also track the story points remaining or remaining time estimate.
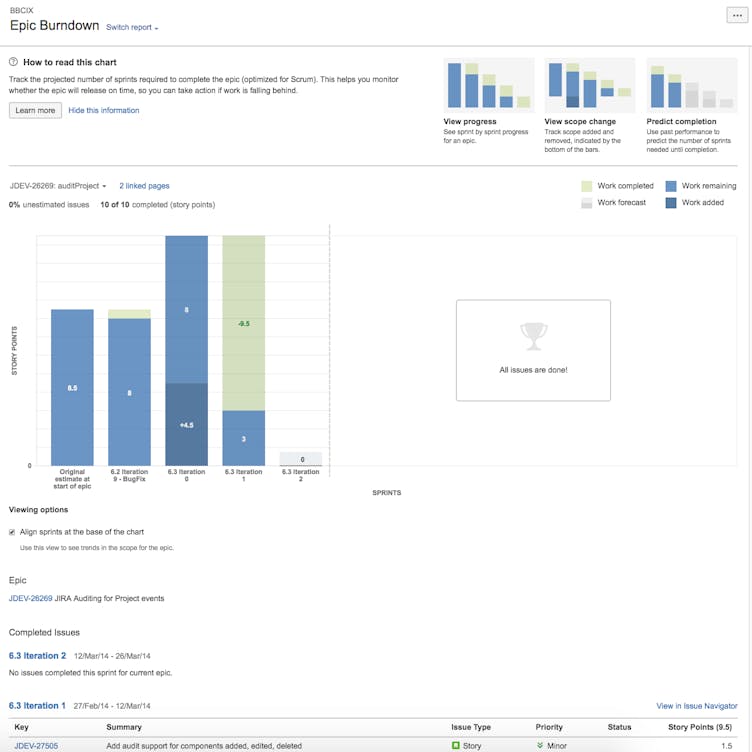
The burndown report lets you go a step further, allowing you to forecast how many sprints will be required to complete an epic or set of epic links. This is a handy feature if your team is using sprints and completing an epic over many cycles.
Unfortunately, the epic Burndown Report does have limitations. As with the epic Report, you can only look at one epic or set of epic links at a time.
Track progress across multiple epics with Hierarchy for Jira
Another way to accurately calculate the completed percentage of your epics is with Hierarchy for Jira. This Jira add-on lets you create an estimate tree which rolls up your estimates from the smallest sub-task up to entire projects or filters. You can easily see how far along each epic is based on the percentage of story points completed or time logged.
And unlike Jira’s built-in epic Report and epic Burndown Report, you can track the estimate progress of multiple epics and epic links on a single page.
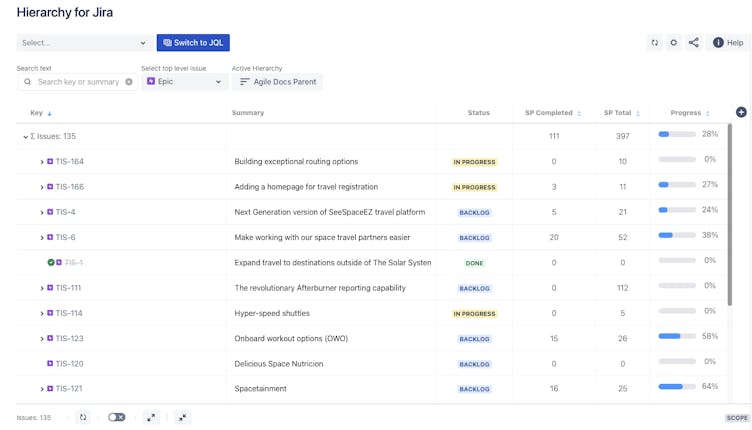
You also get a handy tree view to help you visualise how all the parts of your project fit together.
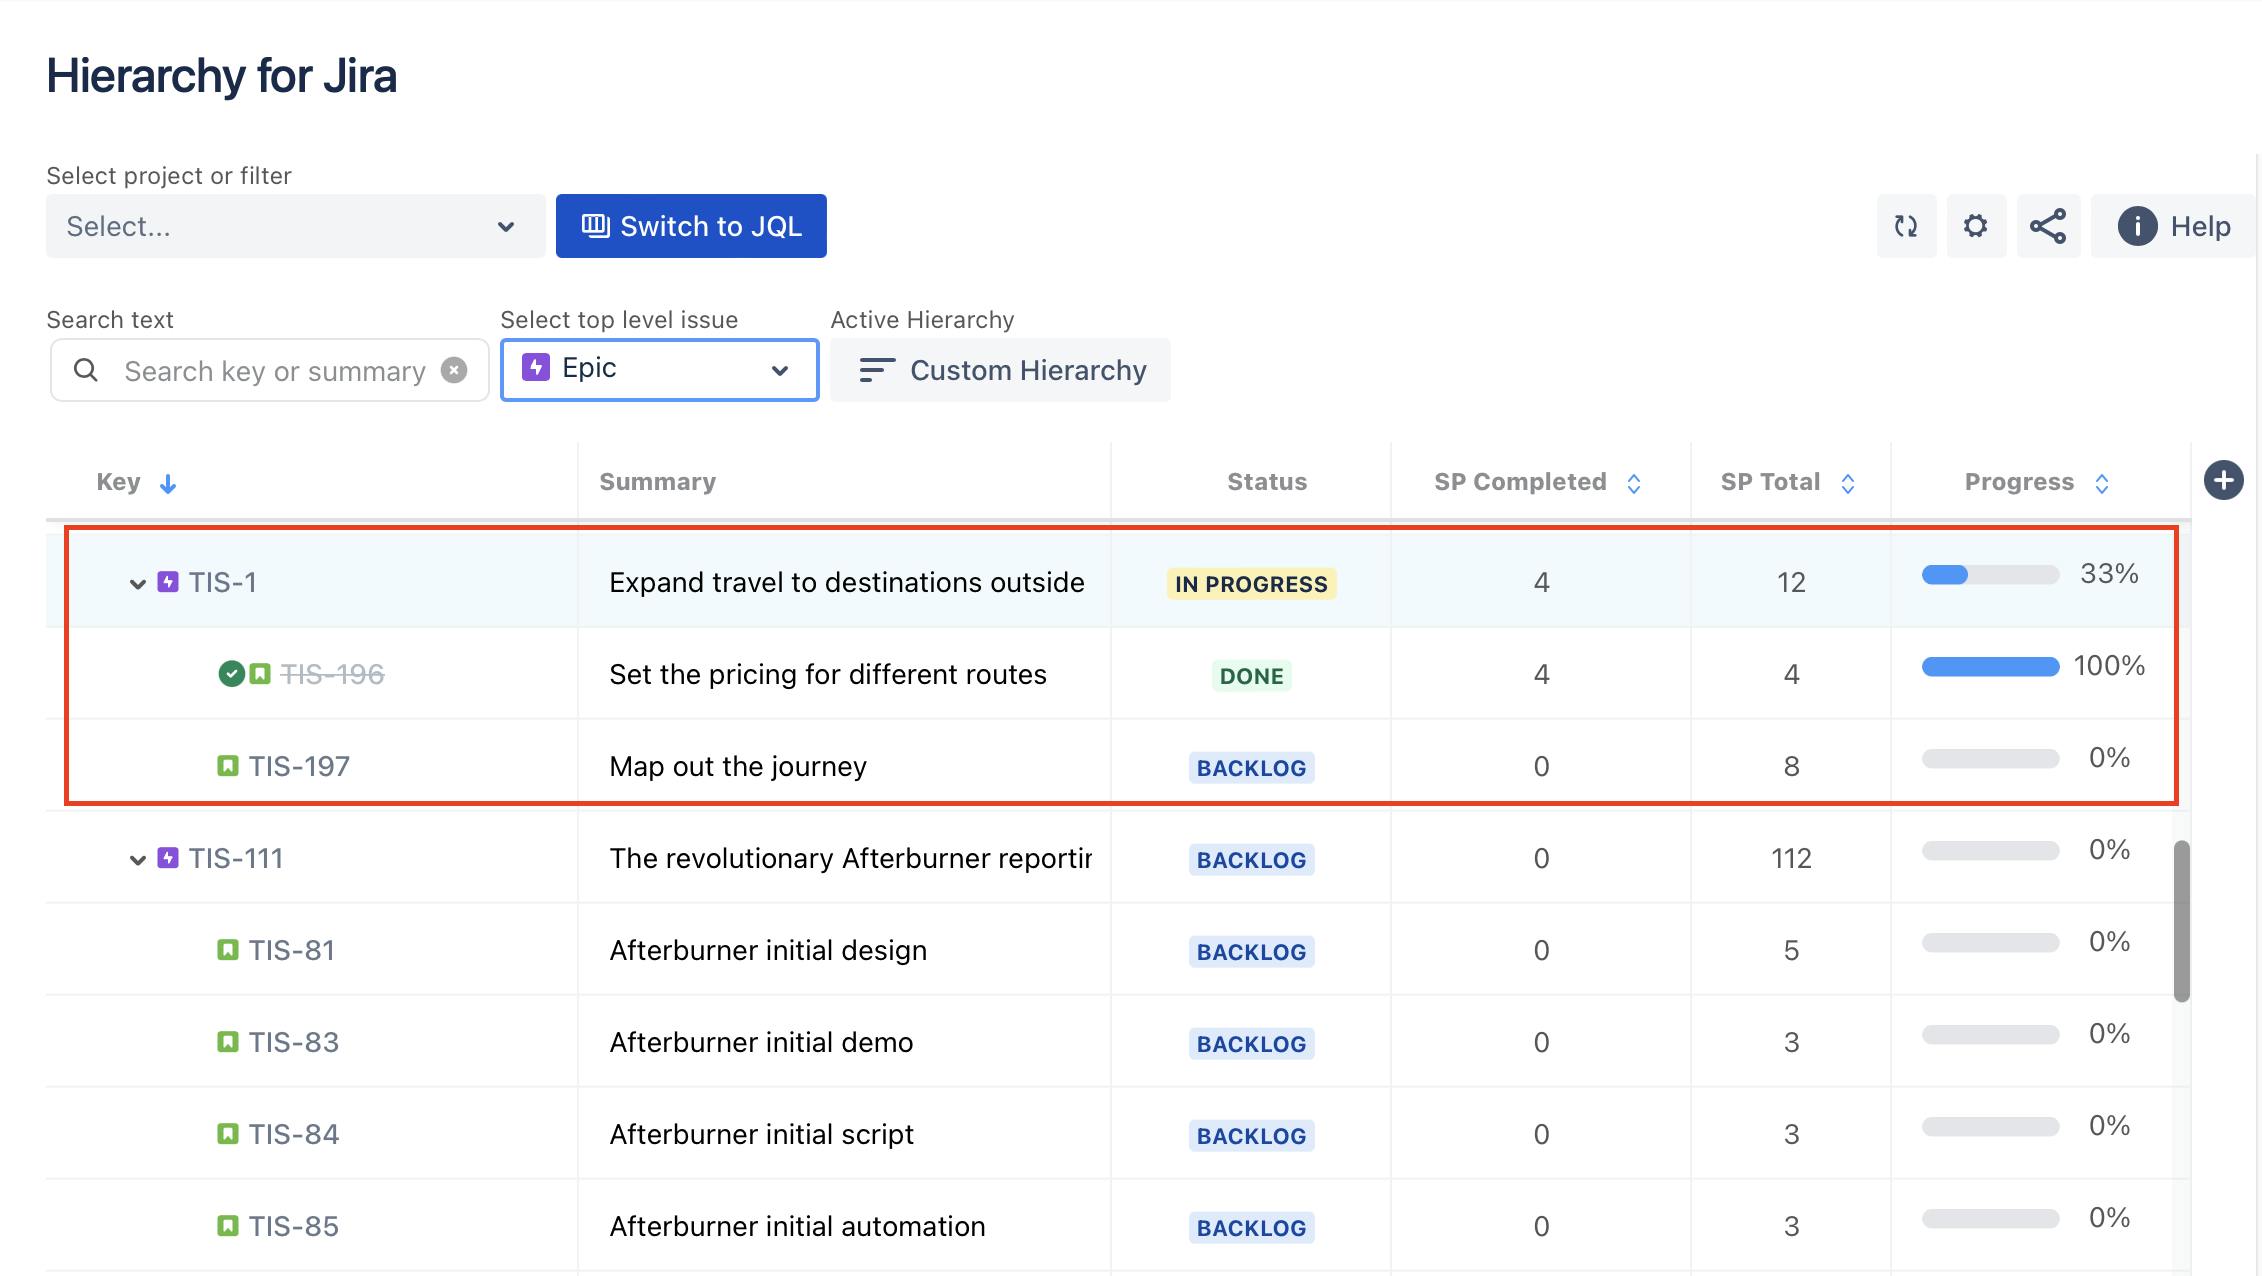
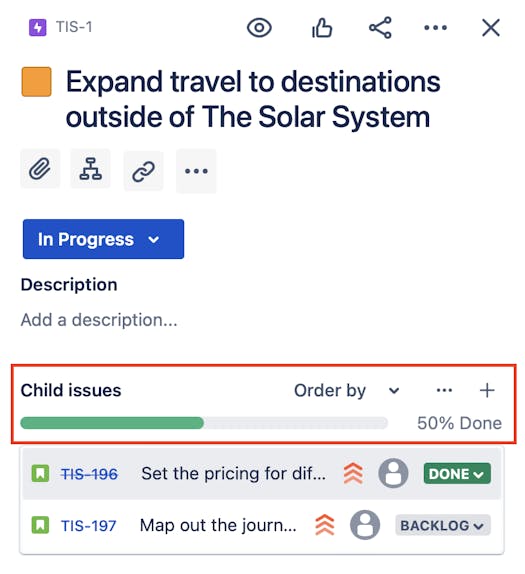
In the example above, the epic TIS-1 contains two stories. One is complete; the other is in progress. If you were calculating gain in terms of the number of issues completed, it would be 50% complete. However, you'll see a very different picture when you drill down into the stories and epics.
The parent epic TIS-1 has 4 story points completed out of 12. This works out to be 33% complete; instead of the 50% complete, we would have worked out from just the number of issues completed.
Hierarchy For Jira breaks this down simply so we can quickly see how the estimate at each level rolls up to the above level.
Generate a consolidated Jira epic progress report
To view a consolidated epic progress report using Hierarchy for Jira, click on the “Collapse“ button at the bottom left. This will give you a condensed view so you can view the estimated progress of multiple epics at a glance.
From here you can sort epics by their rolled up story point or time tracking values to see which epics are lagging in any segment. The ability to sort epics by their estimate progress is not possible with Jira’s built-in epic Report or epic Burndown Report.
Measure Epics progress with Story Point
Measure Epics progress with time-based metrics
If you’re using time-based metrics, you have the options to choose measure progress against “Original estimate“ and “Current estimate“. Select “Time-tracking“ option in the setting. See how you can take your Jira time tracking reports to the next level.
Embed your Jira epic Report in Confluence
If you want to share reports with the rest of the team, you can embed your epic progress reports in Confluence.
Hierarchy for Jira lets you use your saved filters to bring up any set of issues you like. You may have a saved filter which brings up each epic in your initiative, or even epics across multiple projects.
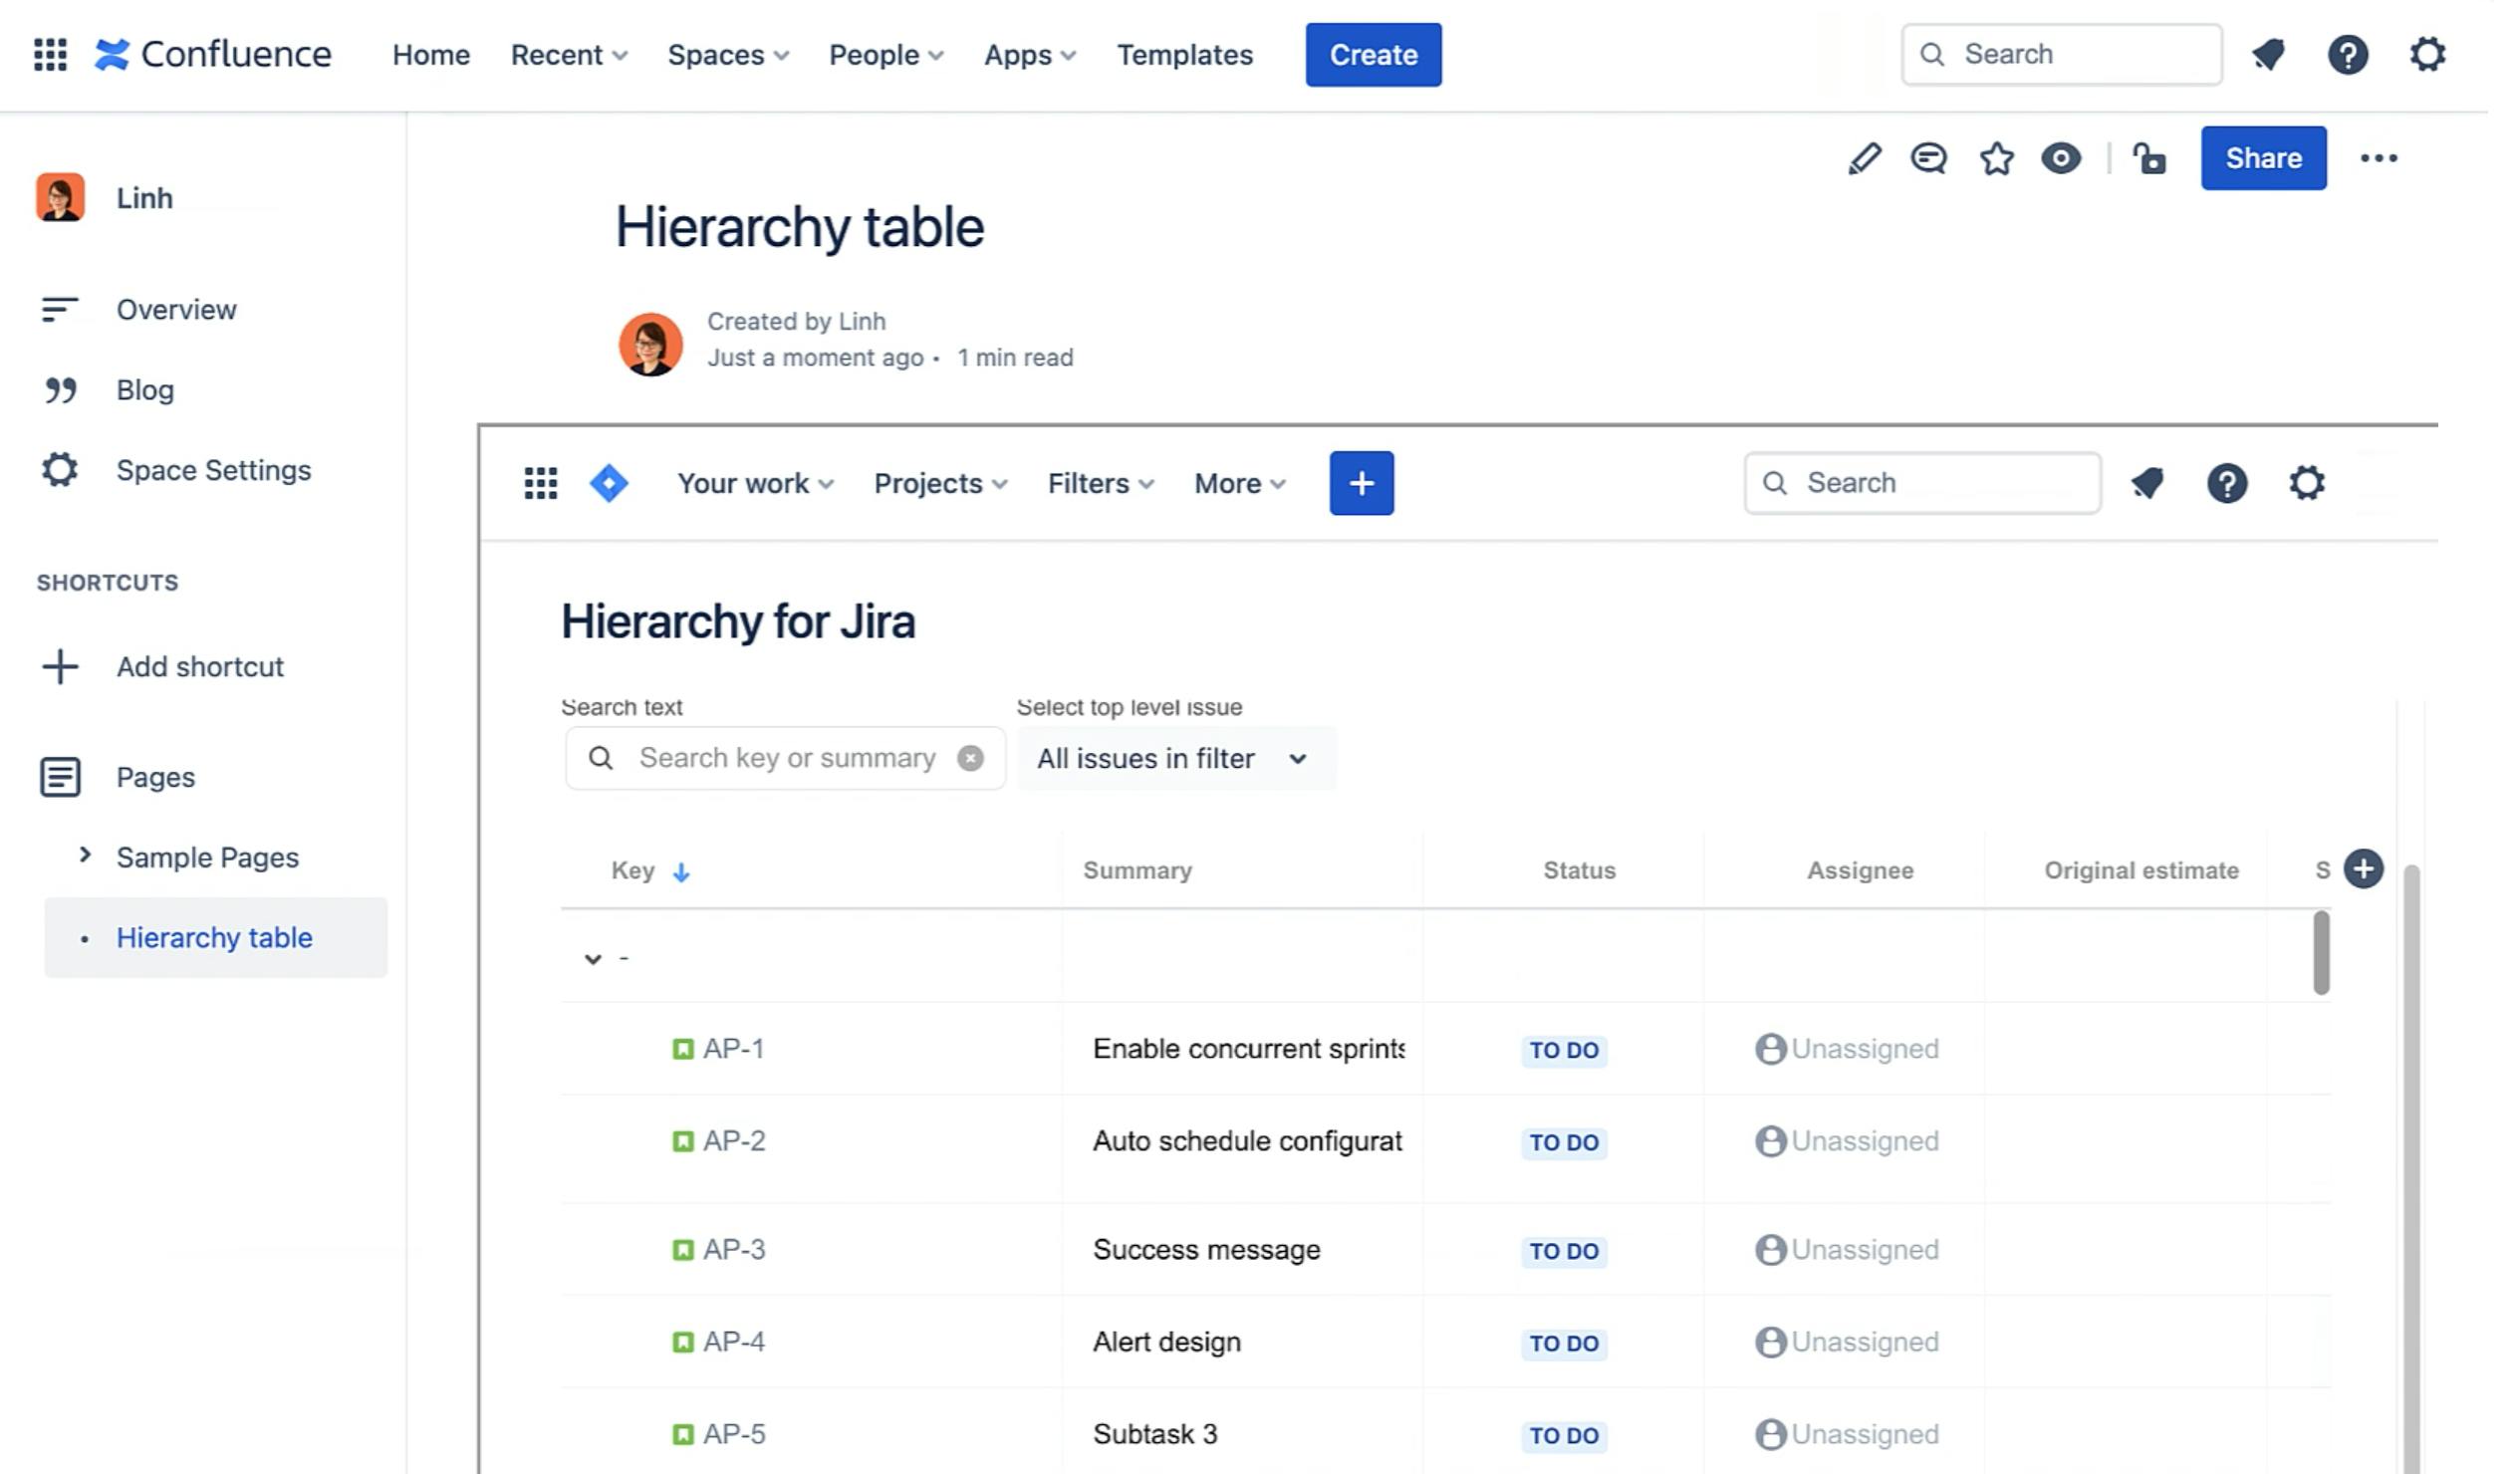
You can copy a link to that filter in Hierarchy for Jira and embed it in Confluence for stakeholders and other team members to see. You can also export your issues to a CSV for use in Excel.
Accurate reporting means better product decisions
For project and product managers, it’s essential to be able to accurately track work in a timely manner. But when it comes to reporting progress, not every user is getting the most from Jira. Hierarchy for Jira is the perfect add-on to enhance your Jira reporting. Best of all, you can try it now for free: