Blog
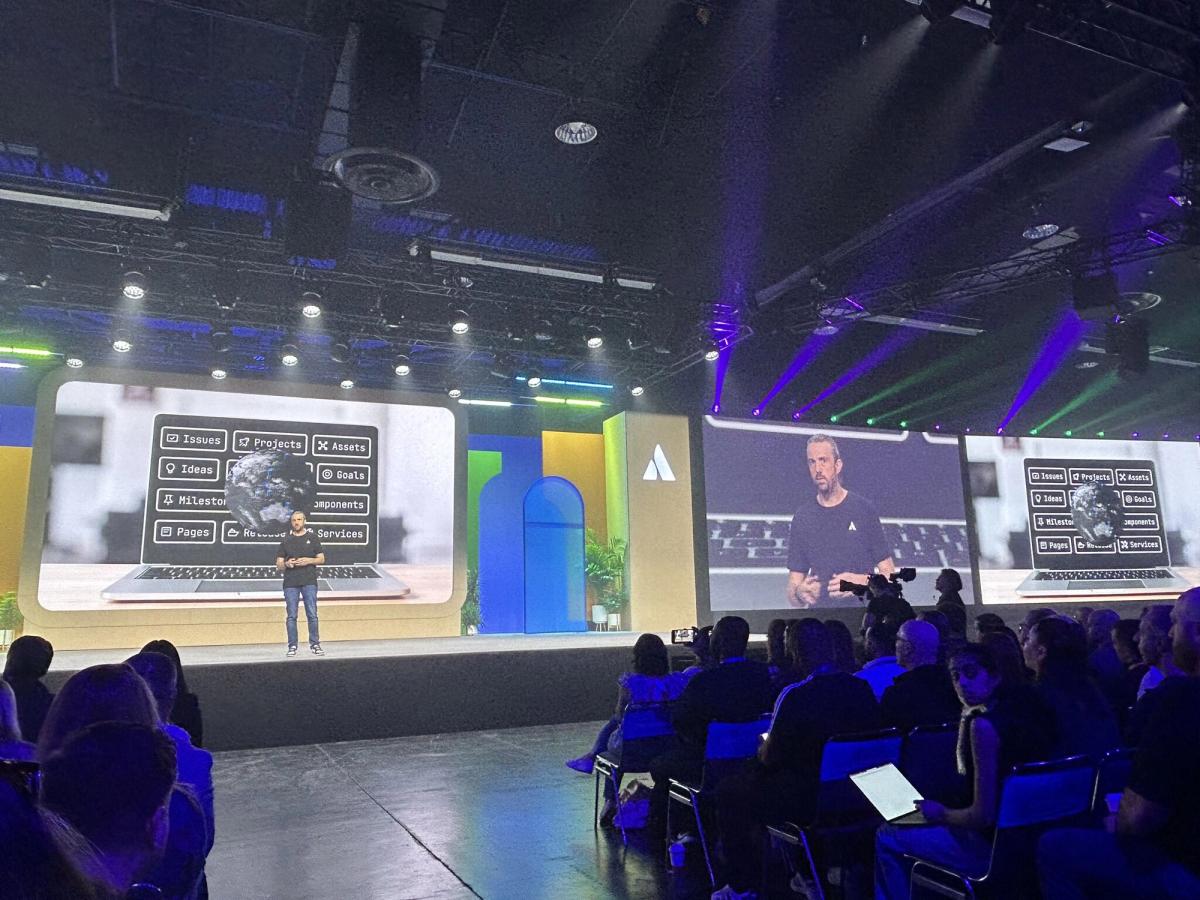
Atlassian Team ‘25 Anaheim Founder Keynote—what you need to know
Key announcements from Atlassian Team '25 Anaheim. New AI, teamwork, and strategy updates for your Atlassian tools.
By The Adaptavist Group
on 15 Apr 2025

The global outage: how to manage the impact of service disruptions
In an increasingly online world, a cyber outage can bring businesses around the globe to a standstill.
By Nikos Georgakopoulos
on 24 Jul 2024
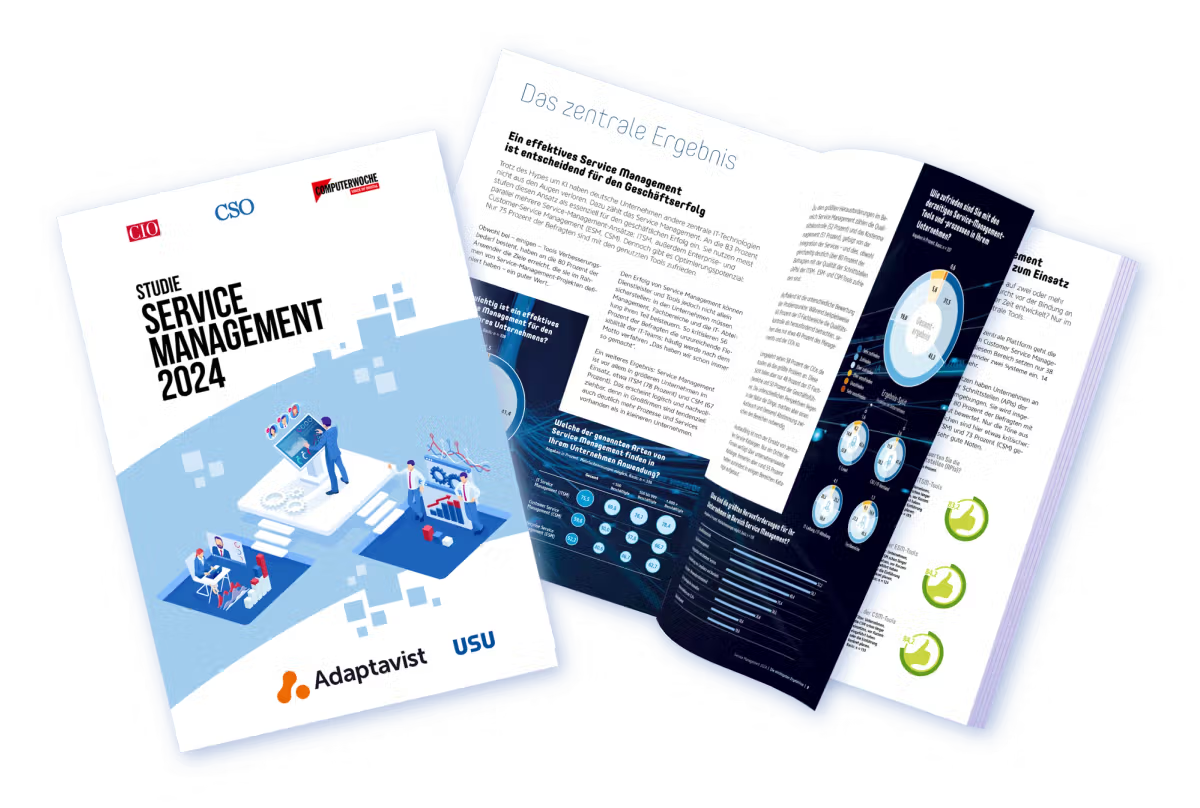
Service management in focus: Identifying and leveraging untapped potential
Discover the importance of service management for business success and how artificial intelligence and cloud computing are shaping the future.
By Alexander Post
on 22 Nov 2024

Modern CRM: From frustration to flexibility
Discover how modern CRMs address common frustrations and how AI can transform your sales processes and beyond.
By Danny Coleman
on 11 Jul 2025

Get the most out of AWS MAP with Adaptavist
Learn all about the AWS Migration Acceleration Program and how our services can help you unlock its benefits and maximise available funding.
By Melissa Hales
on 8 Jul 2025

Highlights from the Banking Transformation Summit 2025
The Banking Transformation Summit 2025, was held in London on 18–19 June. This blog shares our highlights from the event.
By Phill Fox
on 26 Jun 2025

Atlassian platform apps
Atlassian platform apps boost efficiency with AI features and unified experiences, transforming tools like Jira into powerful productivity solutions.
By Matt Doar
on 24 Jun 2025

DevOps
AI
Navigating AI adoption in FSI: compliance, governance, and efficiency
Find out how your financial services organisation can benefit from AI and automation, without compromising on compliance.
By Matt Saunders
on 23 Jun 2025

Boosting developer productivity in banking and financial services
Find out what's holding up developer productivity in the financial service industry – and how you can overcome these common challenges.
By Matt Saunders
on 23 Jun 2025