Kubernetes and GitLab Runner monitoring made easy!
Share on socials
Kubernetes and GitLab Runner monitoring made easy!

Gopal Rathi
Published on 21 December 2023
Last updated on 14 January 2026
5 min read
Gopal Rathi
Published on 21 December 2023
Last updated on 14 January 2026
5 min read
Jump to section
Jump to section
The key players
What you’ll need
Monitoring made easier
Help from the experts
If you're running a fleet of GitLab runners in Kubernetes (K8s) or have group runners for every top-level group in GitLab, monitoring is probably high on your list of bugbears. As your enterprise scales and that workload increases, you'll find it harder and more challenging to manage your K8s infrastructure.
However, monitoring is an essential management task that can't be ignored. This is why an integrated monitoring solution can be a real game-changer. In this blog, we'll explore how monitoring your K8s cluster and the GitLab runners deployed in it can be streamlined using Prometheus and Grafana stacks.
The key players
Let's take a quick look at the core components we're talking about to get you up to speed.
What is Kubernetes?
Initially developed by Google, K8s is an open-source orchestration system for automating deployment, scaling, and managing containerised applications. It's highly efficient and flexible, with features that include automated rollouts and rollbacks, storage orchestration, service discovery and load balancing, secret and configuration management and self-healing capabilities.
What is Prometheus?
Prometheus is an open-source monitoring and alerting system that helps you understand why your application works a certain way. It collects and stores its metrics as time series data, providing a multidimensional data model. It uses PromQL as a query language, allowing you to generate graphs and tables, and has multiple modes for visualising your data, including integration with Grafana.
What is Grafana?
Grafana is a leading platform for observability and data visualisation. You can use the Kube Prometheus stack to create, explore, and share all your data from various sources, including your K8s cluster. Using Grafana makes all this information more easily accessible to everyone in your organisation.
Why is monitoring important in K8s?
With an increasing K8s workload, you'll have lots of resources/pods, making monitoring your applications in production complex. With a monitoring system, you can:
- Receive real-time alerts to identify any problems before they impact your users.
- Understand what you're spending on your architecture as it scales automatically for easier financial planning.
- Improve troubleshooting – monitoring solutions mean no more guesswork when it comes to knowing the source of issues (and how to fix them).
- Know if there's resource contention or uneven pod distribution across your nodes so you can optimise your resources.
- Gain insights into where you can enhance your service. Understand how your users interact with your application, informing decision-making.
What you’ll need
To provide easy-to-operate end-to-end K8s cluster monitoring with Prometheus, you'll need to install the Kube Prometheus stack using the Prometheus Operator. It's designed specifically for cluster monitoring, which means it collects metrics from all your K8s components and comes with useful dashboards from Grafana and built-in alerts.
It leverages the Prometheus Operator, which makes it easier to define and manage your Prometheus resources, alerting rules, and service discovery from within the K8s environments.
This repository package includes:
- The Prometheus Operator
- Highly available Prometheus
- Highly available Alertmanager
- Prometheus node-exporter
- Prometheus Adapter for Kubernetes Metrics APIs
- kube-state-metrics
- Grafana
Installing the Kube Prometheus stack
The simplest way to install the Kube Prometheus stack is by using the package manager Helm. There are only two prerequisites:
Kubernetes 1.19+ or Helm 3+.
Then there are just two steps to get you set up:
1. Get Helm repository information:
helm repo add prometheus-community https://prometheus-community.github.io/helm-charts helm repo update
2. Install Helm chart:
helm install [RELEASE_NAME] prometheus-community/kube-prometheus-stack
Using the Kube Prometheus stack is advisable – it's a highly available, scalable, and cost-efficient solution that's easy to manage. But manual deployment is also an option. If you prefer, you can manually deploy Prometheus and Grafana separately to monitor your GitLab environment. Or use Helm charts to make installation and confirmation a bit more streamlined.
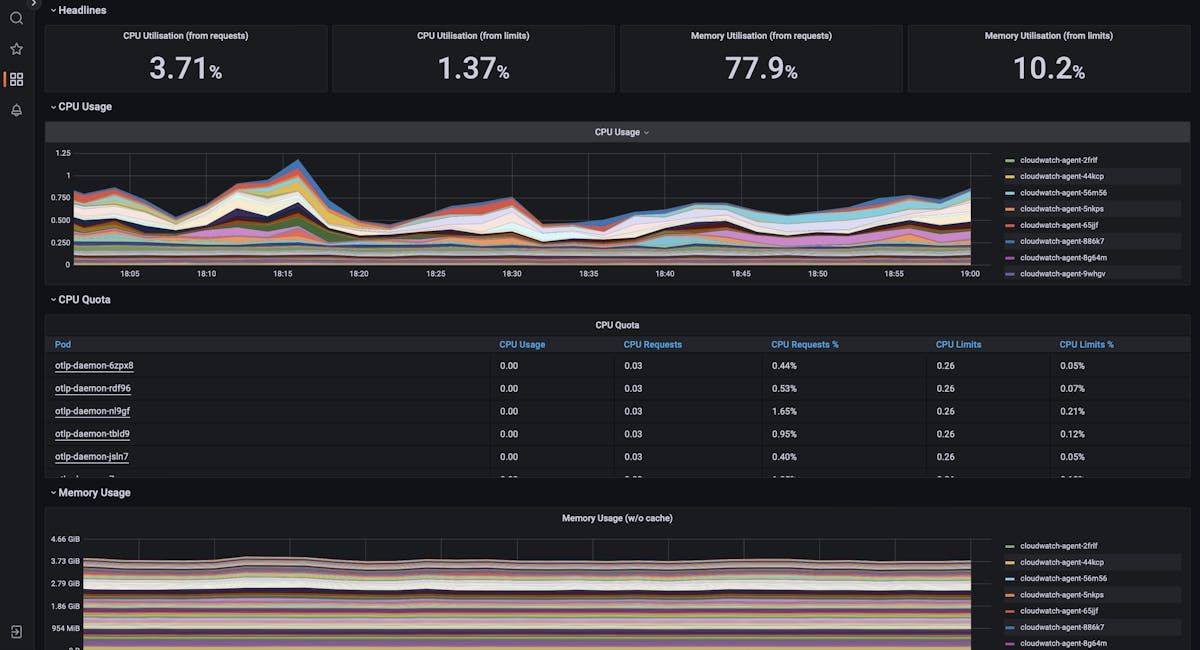
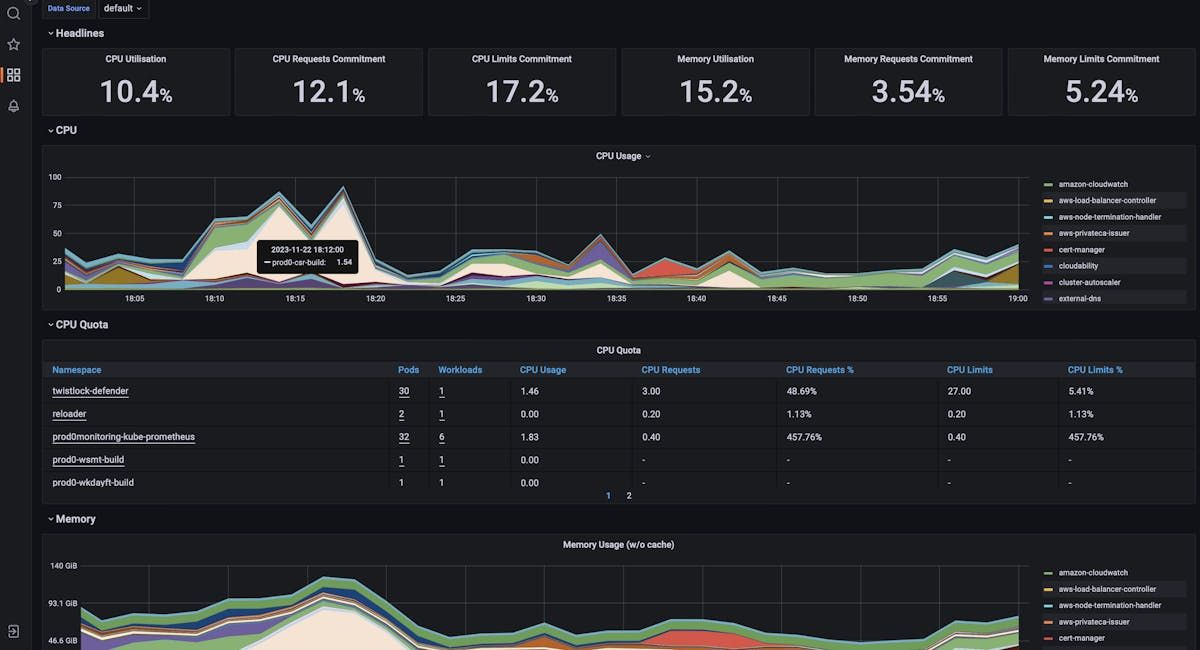
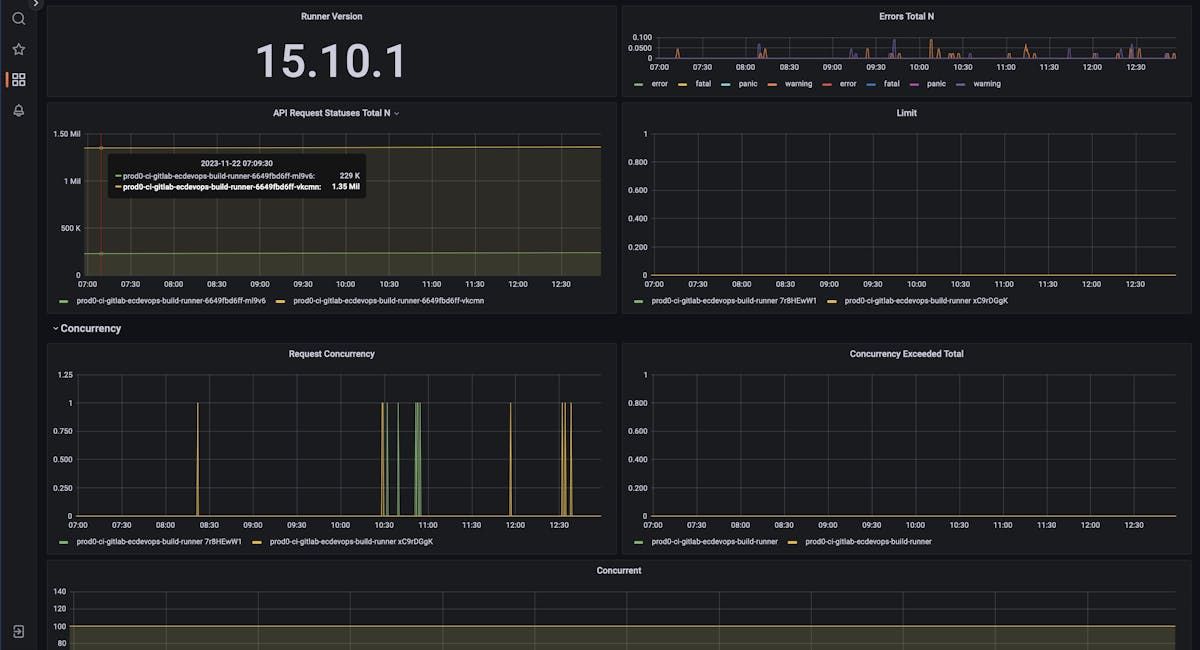
Monitoring made easier
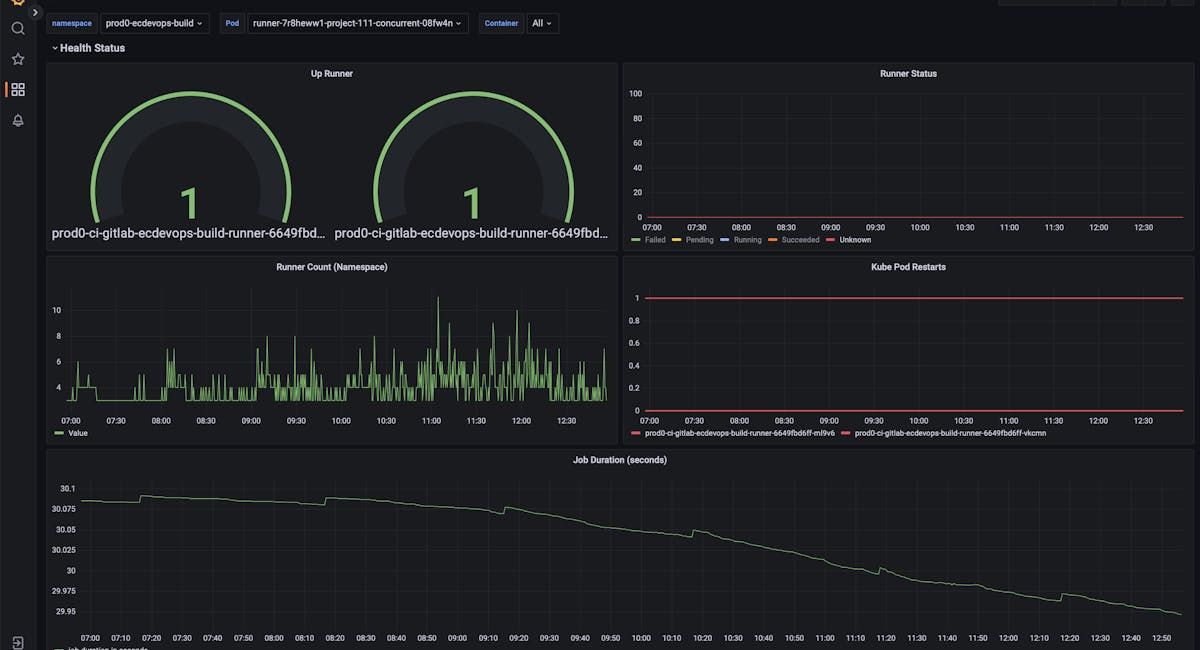
At Adaptavist, we have built a Grafana dashboard to help you monitor your GitLab runners.
Help from the experts
Want to benefit from our custom Grafana dashboard to get more out of GitLab? Adaptavist is a GitLab Select and Professional Services Partner. We offer a full suite of services designed to maximise your investment in GitLab by helping you optimise this powerful tool.
They include DevOps consulting, GitLab implementation and migration, integration support, training sessions for your teams, and managed services – so your people can focus on outcome-based work, and you can rest easy, knowing your system is always up to date.
Get in touch to learn more!
Written by
Principal DevOps Consultant
Gopal is a DevOps expert and solutions architect with multiple certifications, including Atlassian, GitLab PSE, AWS, Kubernetes, and Jenkins. He is passionate about driving business innovation and growth through DevOps practices and cutting-edge technologies.