
Phill Fox
29th October, 2018
Jira


How to visualise your Triage for better Incident Management
Optimising your triage processes in Jira Service Desk helps making your incidents smoother, resolutions quicker and your customers more satisfied.
Making your Incident Management smoother, quicker and more efficient will ultimately improve your customer satisfaction, and I have some tips and best practice to share based upon real-world engagement with many users of both Jira Software and Jira Service Desk. Whilst you can implement some tips on their own, we recommend combining them for best results.
First, let's do a quick health check of how our incident management process is handled. To understand where we are, ask the following questions of your current process:
- How effective is the Triage team when a new incident or Alert arrives?
- How long does it take the team to identify possible known problems?
- Can the team quickly see a list of items awaiting Triage?
Note: our next set of tips use both Jira Software and ScriptRunner for Jira to help with improving your efficient Triage.
Read more:
Visualising your Triage
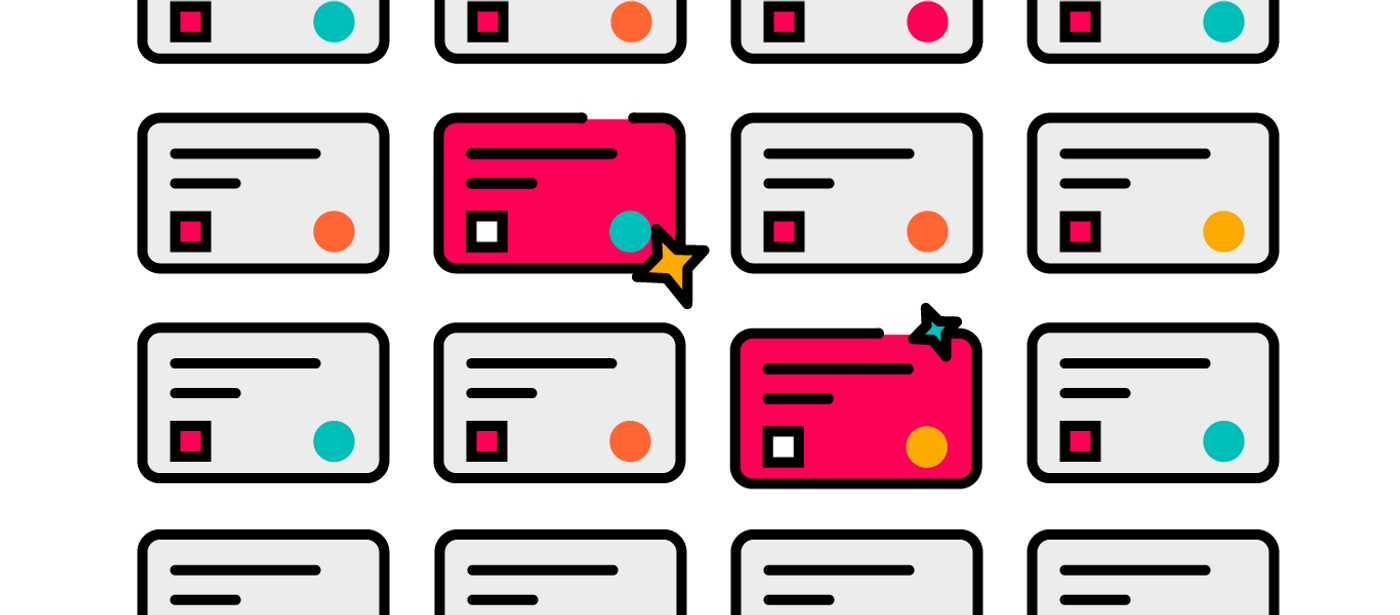
Visualising Issues can be one of the easiest ways to improve your Triage. In Jira, you can create a Kanban board which provides a quick overview of the current situation.
Deciding what to visualise
Depending on your business needs, your Jira instance and projects can get really cluttered with a huge number of Issues. How do you ensure that your Triage Kanban board only shows the Issues that your team needs to focus on?
Firstly, assess what types of Issues you want to prioritise. The Triage team needs to have quick access to current Incidents or Alerts - the known and recent problems - and any outstanding remedial actions. To read more about these four Issue Type, take a look at the first blog in this series. To get to this stage, we need to build a filter for our board. We define this using something similar to the following JQL.
1project in (PM) AND ((issuetype in (Incident, Alert, "Remedial Action") and resolution is EMPTY) OR (issuetype=Problem and (resolution is EMPTY OR resolutiondate > -7d))) ORDER BY Rank ASCTo understand this query let's break it down into its constituent parts:
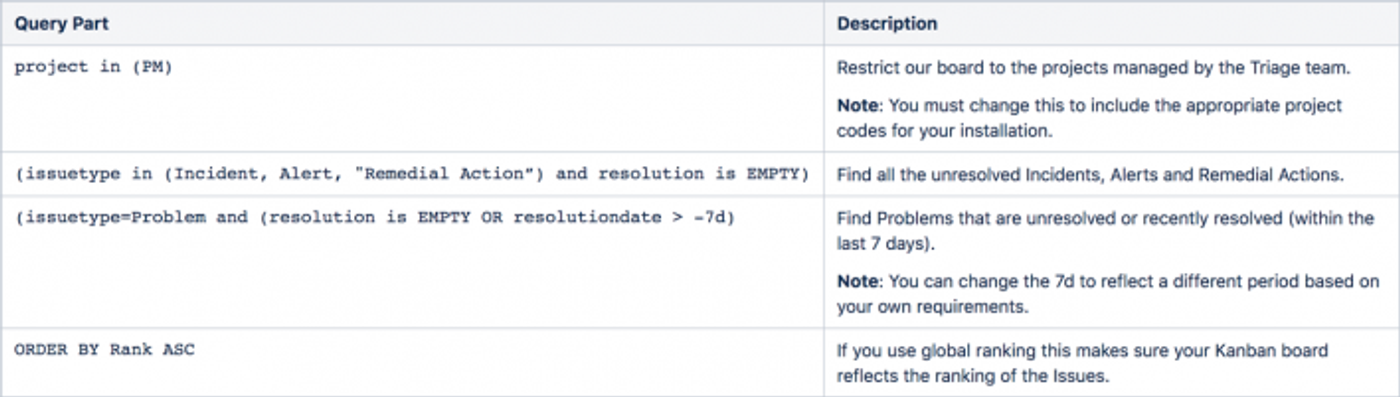
If you use global ranking this makes sure your Kanban board reflects the ranking of the Issues.
Grouping Issue Types together
To help the Triage team respond to the highest priority Issues, we can group the different Issue Types together. We can also promote any Issue to the top of the page if it's been flagged.
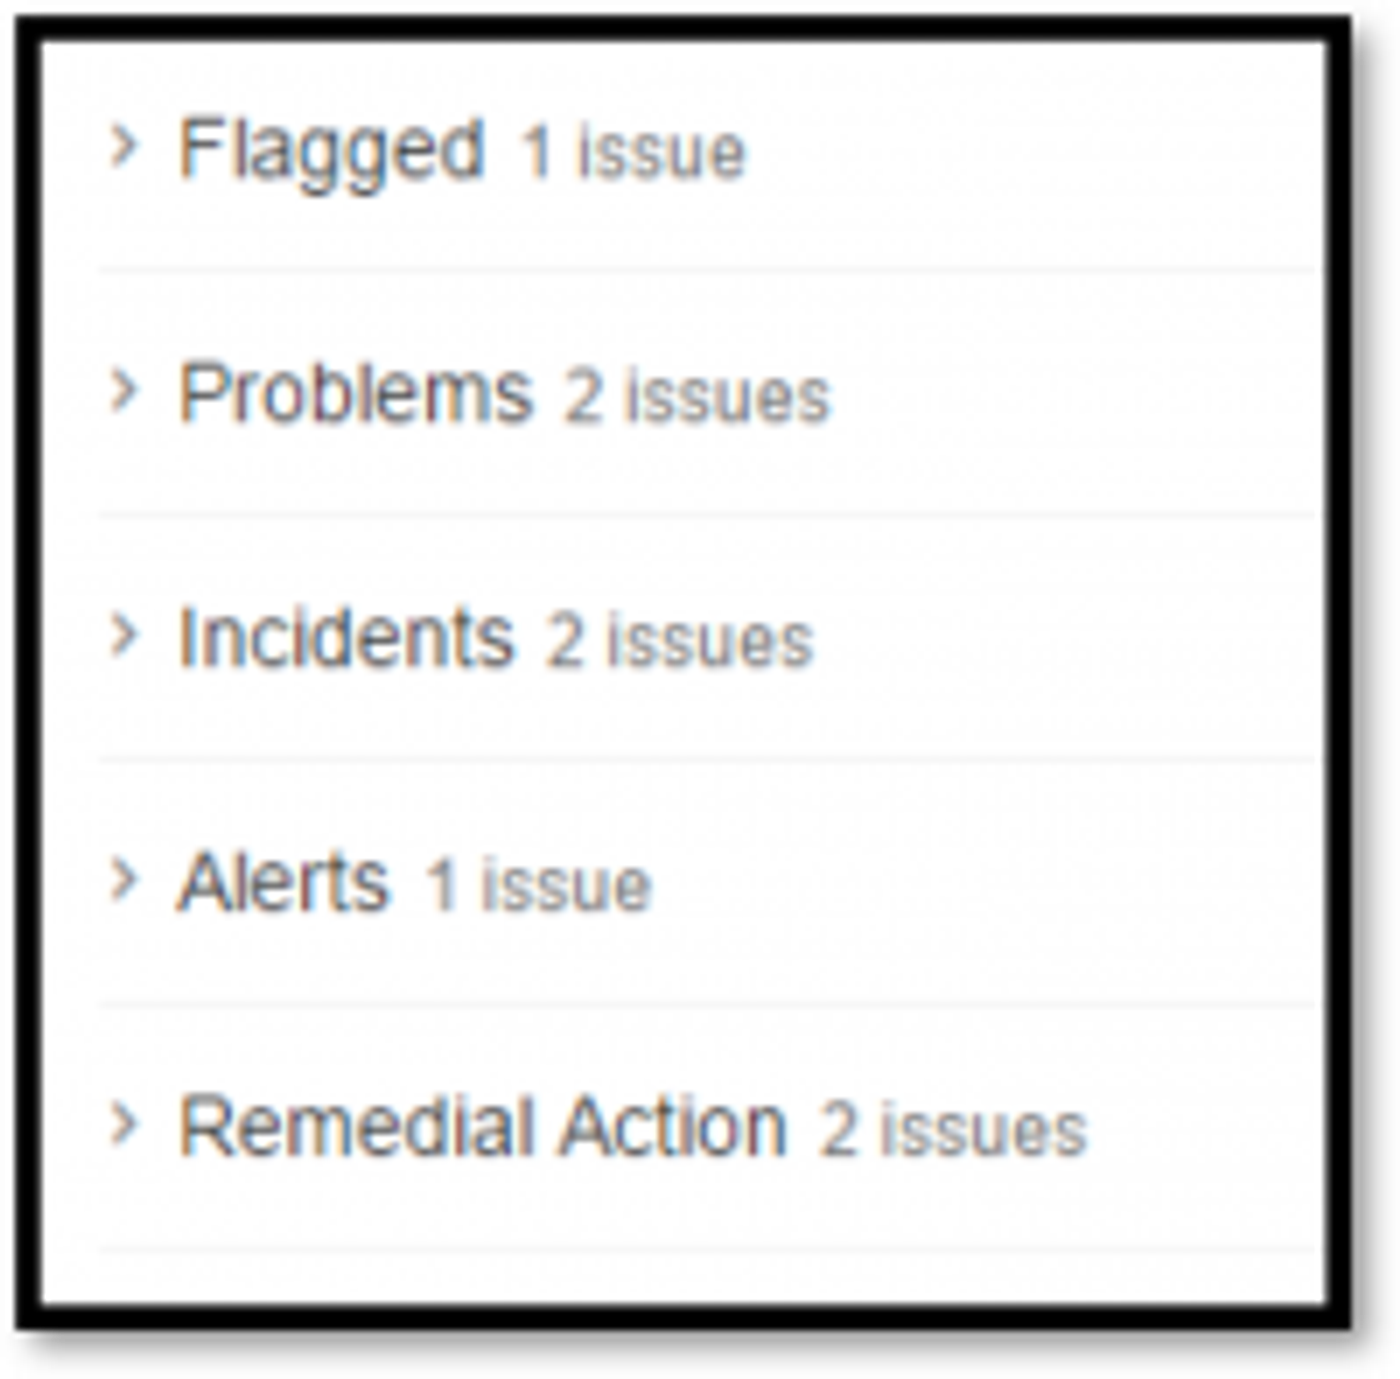
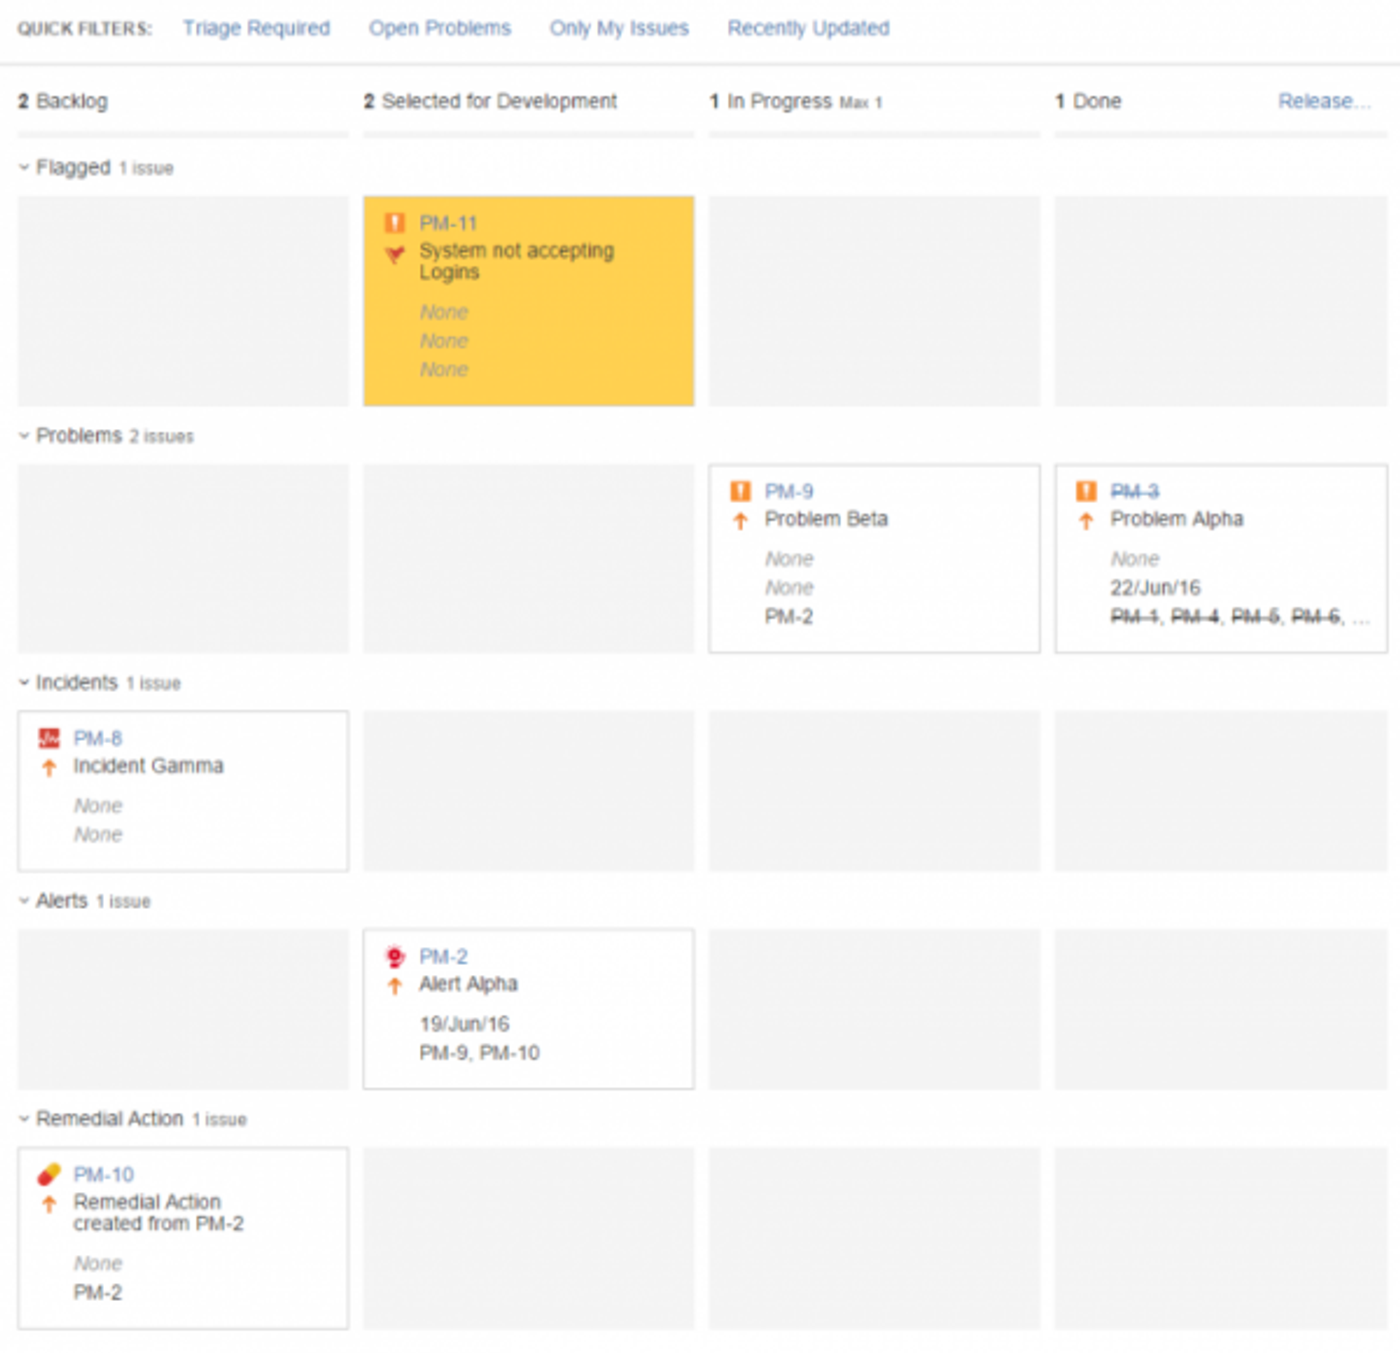
We can use Jira's swimlanes to group Issues. In the diagram above you can see five collapsed swimlanes relating to the four Issue Types and the flagged category. To build the swimlanes we need to define the JQL for each swimlane:
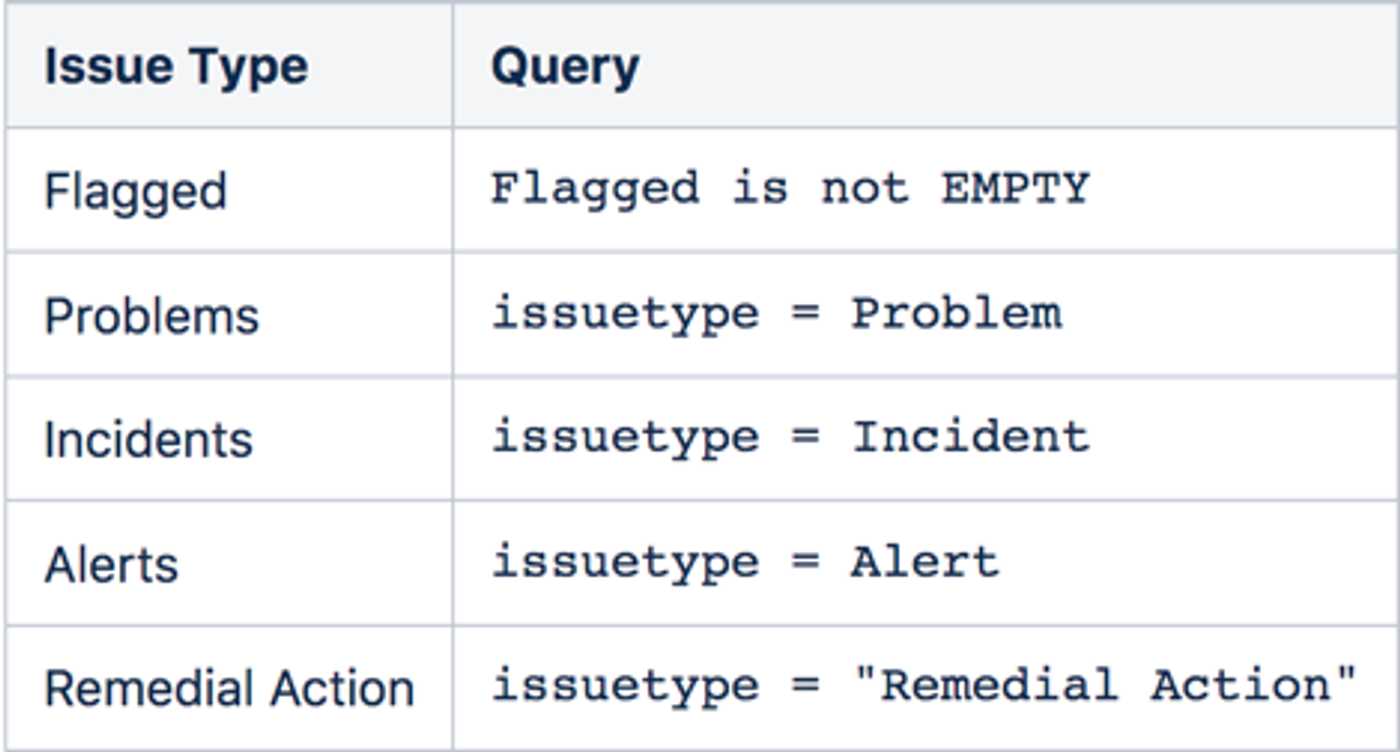
To flag Issues, we've used the standard Jira flagged field to highlight any particularly problematic items. In a future blog we will take a look at how the flagged field can be automatically set when an Issue is approaching an SLA deadline.
Viewing the known problems list
Now that we've created our swimlanes, we could just look at the first three columns of the problem swimlane. These are Issues that are currently in the backlog, selected for development or in progress (see the first image in the blog), however we can improve this view. All we need to do is add another quick filter that returns all the current unresolved problems. To do this we need to add the following JQL to the Kanban board:
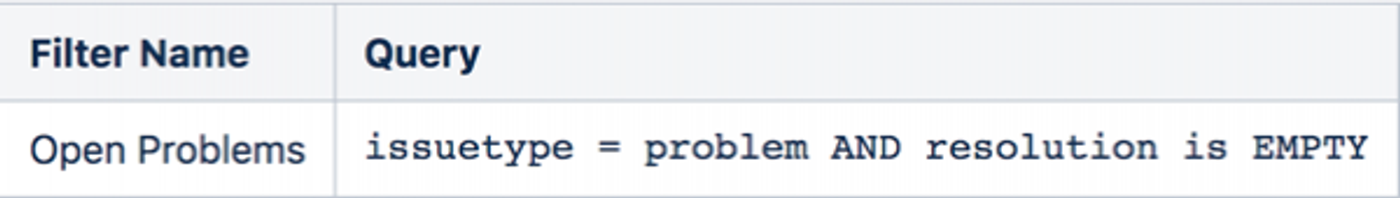
This is a great view for anyone who wants to see what is already in hand, what is marked for resolution and can be used as a quick reference point when new Incidents occur to confirm if it is related to a known problem.
But Triage is different
To give the Triage team the ability to make the best decision on Issues that come in, we need to allow them to view new Incidents and Alerts with both unresolved problems and those that have been recently resolved. We do this by adding the following JQL to the board:
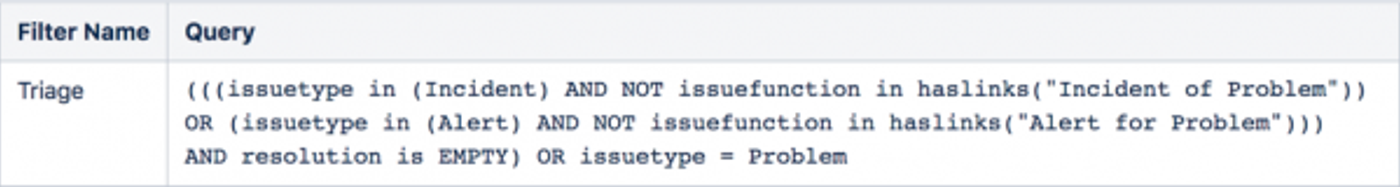
Diving into this query, those familiar with JQL might notice that there are a few parts that aren't standard JQL. The above query uses ScriptRunner for Jira's JQL extensions, let's take a look at what each part does:
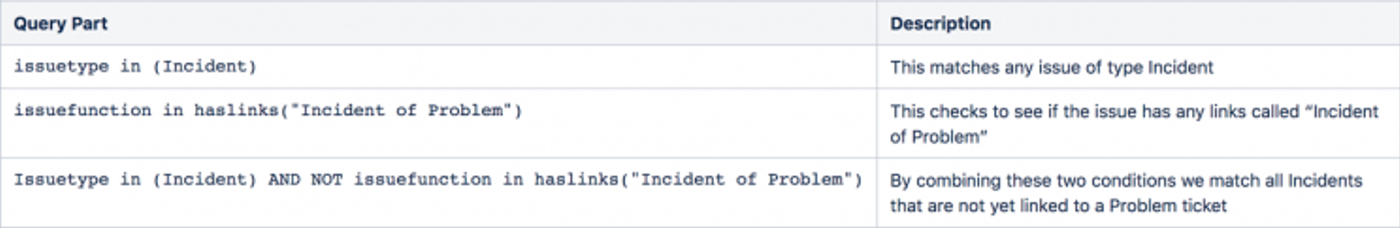
By combining these two conditions we can quickly identify all Incidents that are not yet linked to a Problem ticket along with the current open Problems.
So that's a simple way to visualize your Incidents and Alerts to increase the efficiency of your Triage. Check out some other tips for ways to improve your triage management or, if you don't have ScriptRunner for Jira yet, start a 30 day trial via the Atlassian Marketplace.